
GolfMAP – Explained
NGF GolfMAP (Golf Market Analysis Platform) is one of the most robust data-driven analytical tools available to NGF members, delivering intensely detailed information about golf micro-economies across the United States. It is the single best resource for quality data on golf supply and demand.
The GolfMAP system, which is easy to learn and navigate, provides exhaustive demographic data and curates a wealth of proprietary NGF research-based data that golf businesses – from retailers to owners and multi-course operators – utilize to better understand specific markets and make critical decisions.
“From a business development standpoint, I use it to speak in a more educated manner on a specific market to a prospect,” said a business development specialist at one of golf’s leading third-party management companies. “There are certain markets that I don’t know well. The ability to produce a GolfMAP report within a given radius helps give me a little more context from a higher level as to what the current environment is from a golf perspective, what the potential is, what the competitive environment is.”
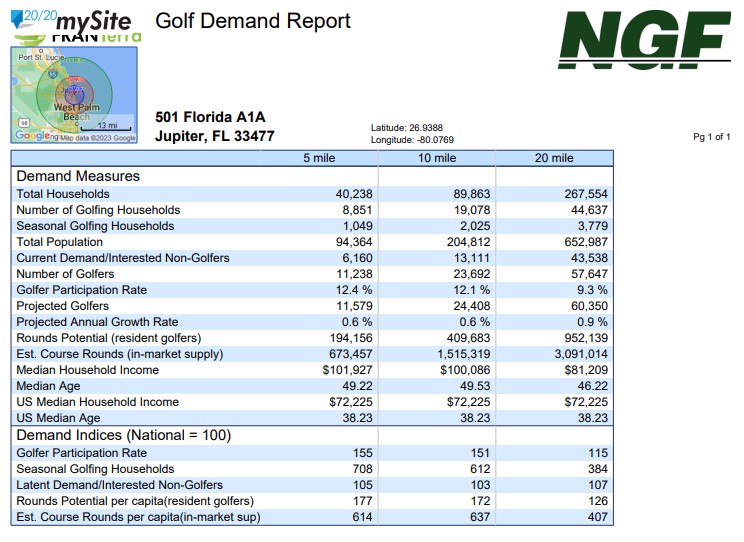
Examples of data and metrics available by searching geographic areas (e.g., mile radial, travel time, county, core-based statistical area) include:
- Golf participation rates
- Number of golfing households (permanent and seasonal)
- Golf supply and demand indices (e.g., total households per 18 holes ‘Premium’ public golf) for comparison between markets
- Population demographics, including income, age, ethnicity, and population, with future projections
- List of golf facilities, ranges, golf specialty retail stores and sporting goods stores (verified annually)
- Golf courses in planning and under construction
- Change in golf course supply (5- and 10-year)
- Rounds-played (estimated from user provided data and ongoing NGF consumer research)
- Latent demand estimate (the number of interested non-golfers)
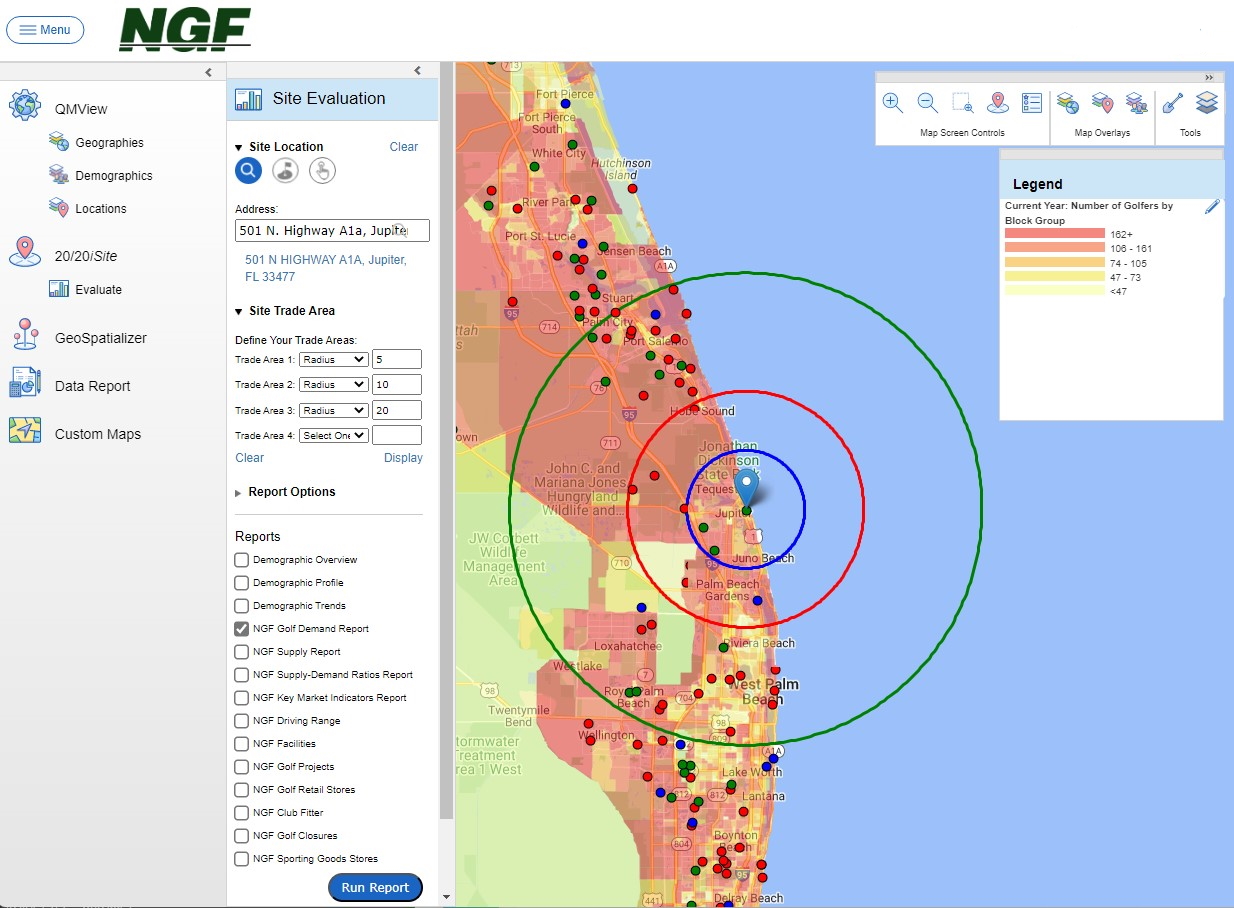
GolfMAP licensees generate high-level snapshots to evaluate markets of interest, utilizing the system for various purposes such as market evaluation, portfolio analysis, and preparation of presentations. For example, a retail chain would use the data and mapping capabilities to help decide whether a particular market has sufficient golfer-rich areas to be a strong candidate for a new store (The system also provides an estimate of golf equipment spend in the chosen markets).
Golf course management companies use the system to evaluate the strength of markets when considering purchasing or leasing a facility, to better understand whether a property under management is under- or overperforming, or to convey market knowledge when responding to a municipal RFP (Request for Proposal) for a new facility management opportunity. Finally, a variety of other clients use GolfMAP to help streamline marketing campaigns, allocate money more efficiently, and identify golfer-rich areas that might yield new customers.
“It gives me interesting insight as to what’s going on in a certain market,” according to another GolfMAP licensee, who noted an almost daily use of the platform. “I do provide prospects with some snapshots of this data to show them that we’re not just blindly guessing. It makes me a little smarter than I am about the market, but that’s because NGF has aggregated all this data.”
GolfMAP licensees that have a sufficient number of facilities or stores use the data to analyze their portfolios. For instance, a multi-course owner or operator will try to identify correlations in variables for both their best-performing and under-performing facilities, looking at key demographic data, as well as market-based metrics such as the number of golfers per 18 holes, golf participation rates, and median household income.
GolfMAP also has more in-depth outputs such as historical weather and traffic counts.
“It does a complete survey of traffic counts by intersection, starting from the closest one to your subject and goes out from there,” says golf course appraiser David Hunnicutt, the President and owner of Hunnicutt and Associates. “That’s useful in plotting time and distance frictions, which are important to golf. If you’re doing any kind of retail analysis, you want to know where your traffic flows are. Population can be in one place but traffic flows can be someplace completely different. So that’s really important.”
Another useful utility of the platform is the ability to create heat maps around a subject facility, retail store, or prospective location, overlaying the thematic golf and demographic variables that are of interest for that particular market. For golf companies selling a high-end product, GolfMAP can identify and map zip codes that have a particularly high number of households with an average income in excess of a target threshold, such as $150,000.
GolfMAP is also useful in green grass shop sales analytics and optimization, helping businesses identify which accounts they should go after.
An annual license provides unlimited use of the interface for an entire year. Reports are easily exportable to Excel and the system is backed by NGF’s experienced analytical and technical support.

